
RSI divergence is a useful tool for tracking the trend in the early stage. It helps traders to see when momentum is slowing down. This gives traders clues before the price moves in the other direction. In this guide, you will learn how to trade RSI divergence step by step. We’ll use simple tools and easy methods you can use right away. Whether you’re new or experienced, this strategy can improve your trades.
What Is RSI Divergence?
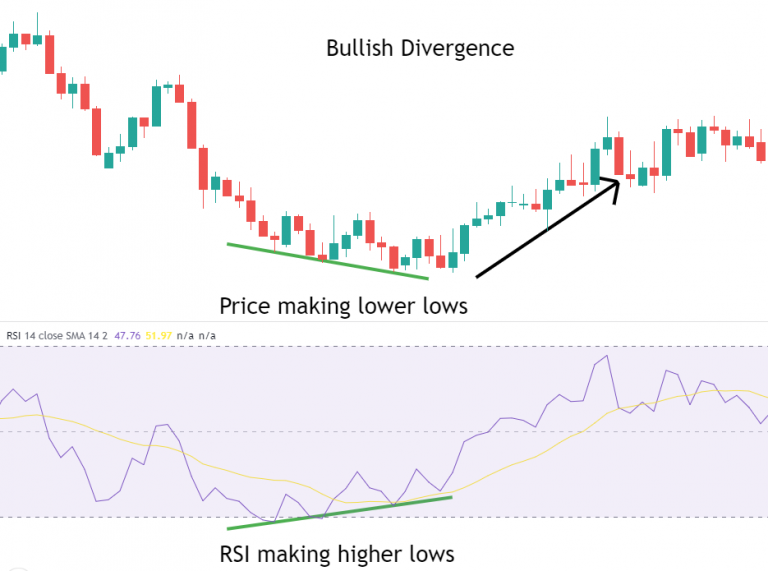
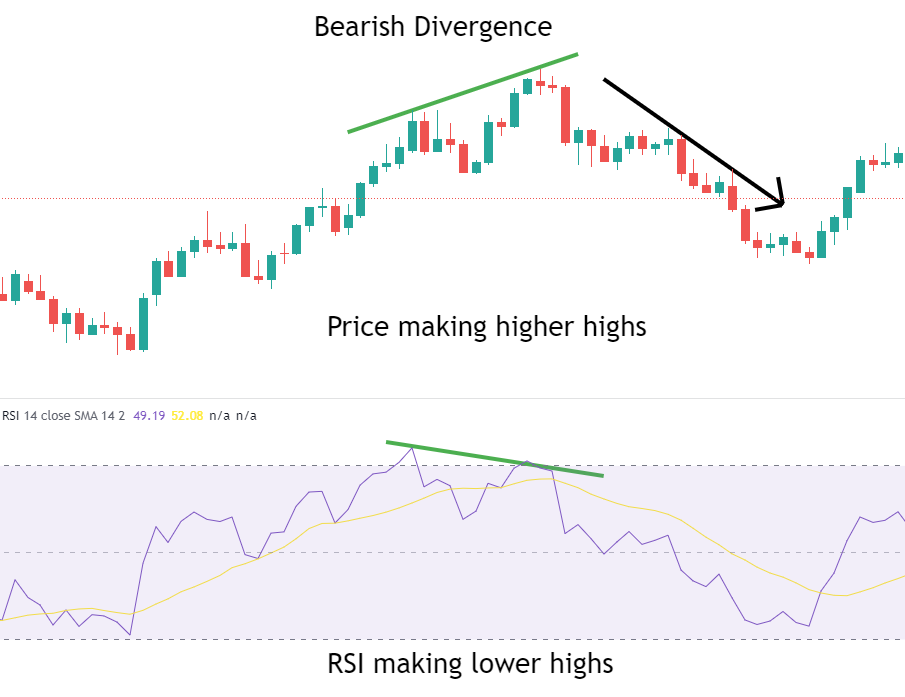
RSI divergence indicates when price and RSI move differently. It is a signal that a trend may be losing strength. The RSI is a tool that shows market momentum. It moves between 0 and 100. The range shows if the price is strong or weak. Above 70 means overbought. Below 30 means oversold. If price makes a new high but RSI makes a lower high, it’s bearish. If price makes a new low but RSI makes a higher low, it’s bullish. RSI divergence helps traders spot possible trend reversals early.
1. Regular Bullish Divergence: This indicates when the price makes a lower low and the RSI makes a higher low. It signals that selling pressure is weakening. Large buyers may be accumulating quietly. Sometimes this pattern is created after sharp drops or in panic-selling phases. It sees assets like Bitcoin and Nasdaq stocks after major corrections.
 2. Regular Bearish Divergence: the price makes a higher high, but RSI makes a lower high. It shows that buyers are losing strength. The rally may come with emotion or low volume. Sometimes this divergence indicates near market tops. It can happen after the news kicks back to the price up quickly. This sign came before drops in Tesla and Ethereum.
 3. Hidden Bullish Divergence: The price makes a higher low, but RSI makes a lower low. This suggests that the trend is still strong, even during pullbacks. Hidden bullish divergence is used to confirm continuation trades. This signal often appeared during shallow corrections in trending assets like Solana or Nvidia in 2024–2025.
4. Hidden Bearish Divergence: This market structure indicates when price makes a lower high but the RSI makes a higher high. It warns that the downtrend still has strength. If the price looks like it’s recovering. This setup is useful for identifying “bull traps.” Traders saw this in 2025 during recoveries in meme coins and overbought tech stocks.
Tools Needed to Spot RSI Divergence
Traders need a basic chart platform to spot RSI divergence. Some Popular tools like TradingView, MetaTrader, or Binance charts work well. Next, a trader must add the Relative Strength Index to their chart. Use the default setting, which is a 14-period RSI. This means it calculates momentum based on the last 14 candles. You’ll see the RSI line appear below your price chart. Now you can compare RSI movements with price highs or lows. No paid tools are needed for checking RSI divergence. A trader just needs a clear chart and the RSI indicator.
How to Identify RSI Divergence
If a trader follows these simple steps, then the trader will find that RSI divergence is easy. This method is using traders across crypto, forex, and stocks in 2025.
Step 1: Open the RSI Chart: Open a chart on TradingView or MetaTrader. Next, add the RSI with a 14-period setting. It shows the market how strong or weak.
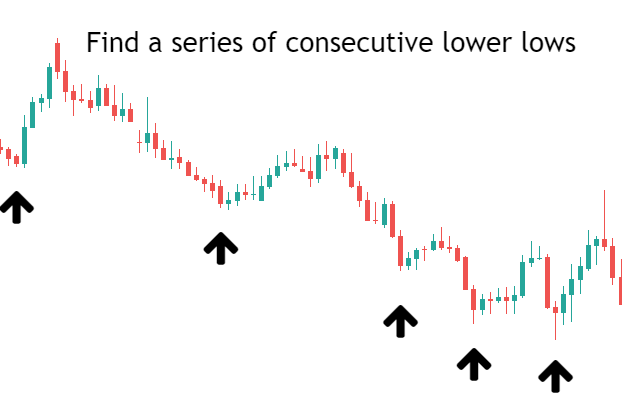
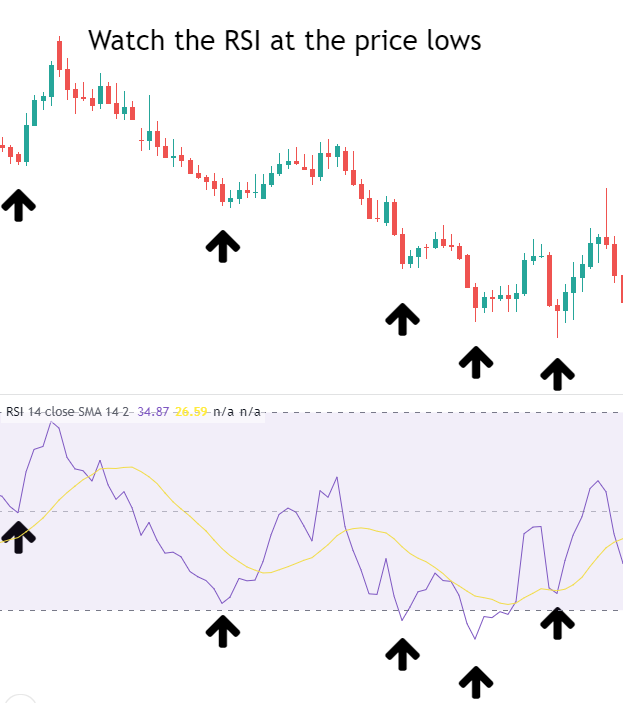 Step 2: Spot Price Highs or Lows: Find the latest high or low on the chart. You can draw lines to mark these points. It shows whether the price is going up or down.
Step 3: Compare with RSI Movement: Check if RSI moves differently from the price. If price makes a lower low but RSI makes a higher low, it’s a bullish sign. If the price makes a higher high but RSI makes a lower high, it’s a bearish sign. This chart shows that the current trend may slow down.
Step 4: Confirm with Price Action: Don’t trade on RSI signals. Firstly, traders must wait for strong candles or breakouts. Traders also must look at volume and trendlines.
Mistakes to Avoid While Trading RSI Divergence
Trading RSI divergence can help take trades. But a mistake indicates losses. One mistake is trusting RSI alone. Divergence may not mean the trend will change. Always check price action, trendlines, or candle patterns. Another error is using low-volume charts. Sometimes, Low-volume assets can give wrong signals. For better signals trade, traders must use high-volume ones like Bitcoin or big stocks. Many traders trade in every small divergence. This causes overtrading and losses. Some divergences fail in strong trends. It’s the best method to wait for clear signals on 4-hour or daily charts.
Pro Tips for Better RSI Divergence Trades
To make better RSI divergence trades, follow these easy steps. These help you avoid wrong signals and trade smarter in 2025.
Firstly, the trader must use RSI with other tools like MACD, trendlines, or moving averages. The signal will strong when both RSI and MACD show divergence.
Secondly, always check important support or resistance levels for divergence. These spots can make the price go up or down.
Thirdly, in the chart, traders must use multi-timeframe analysis. Look at RSI on bigger charts like 4-hour or daily. Then check smaller charts like 1-hour to time your trades well. This helps find good signals and avoid bad ones.